Connect the data
Approve the required Shopify permissions and sync the store data. Collection engagement also needs measurement enabled and the relevant shopper consent.
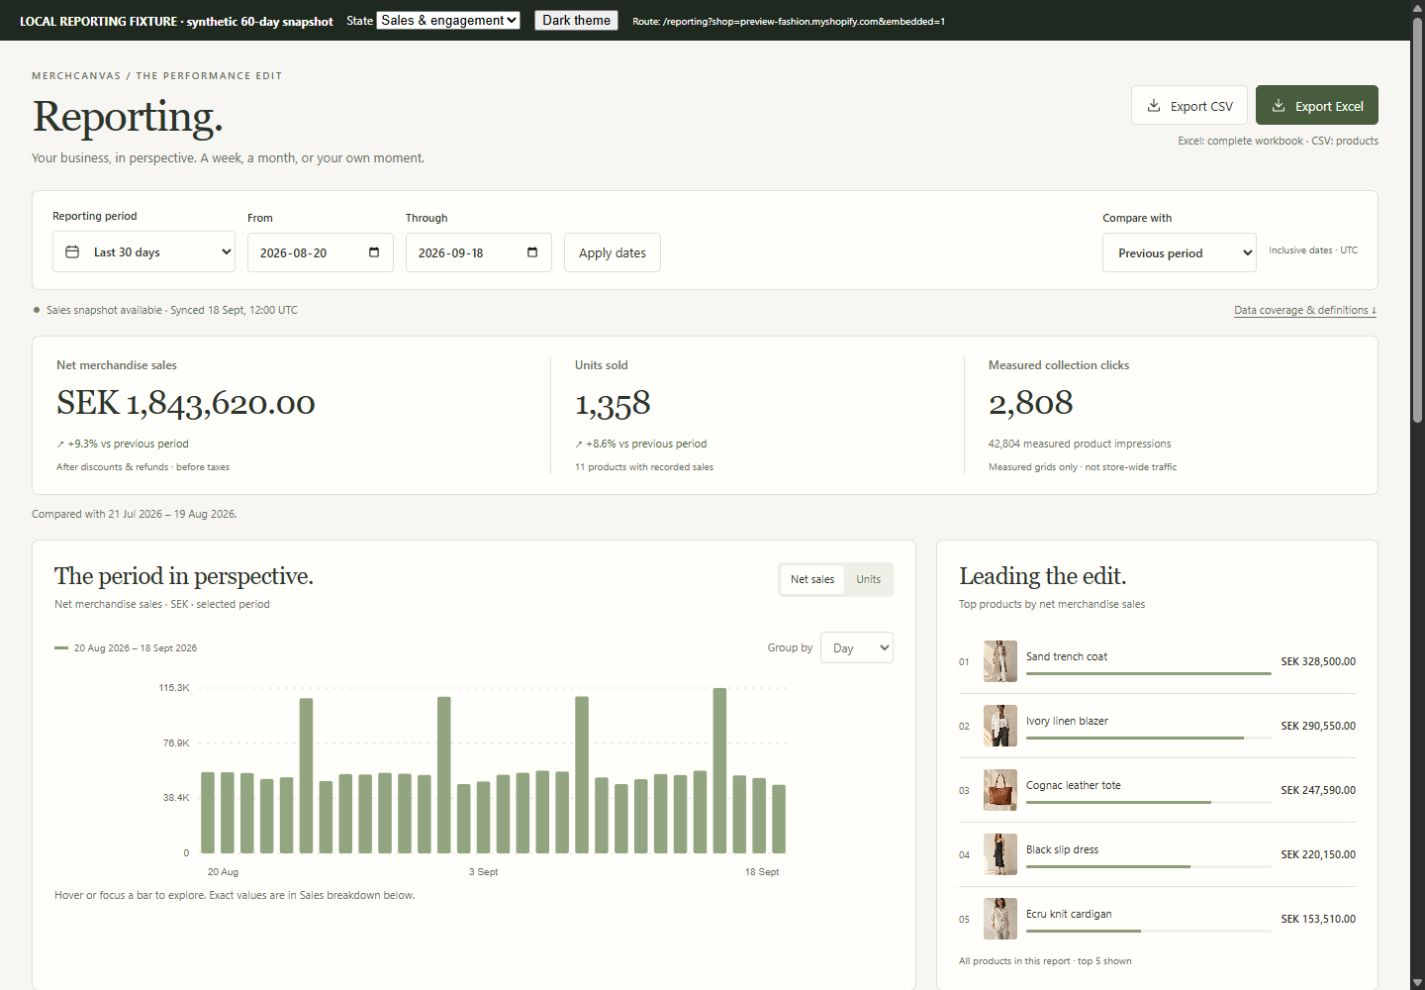
Bring product performance into the merchandising conversation. Explore sales and measured collection engagement, choose a reporting period, and take the detail into Excel or CSV.
Explore individual product performance, then build a report for the period and assortment you want to discuss. Available data stays distinct from missing history.
Bring sales trends and current inventory into the same working view. Narrow the assortment to a collection, category or tag, then open a product for a closer look at its available data.
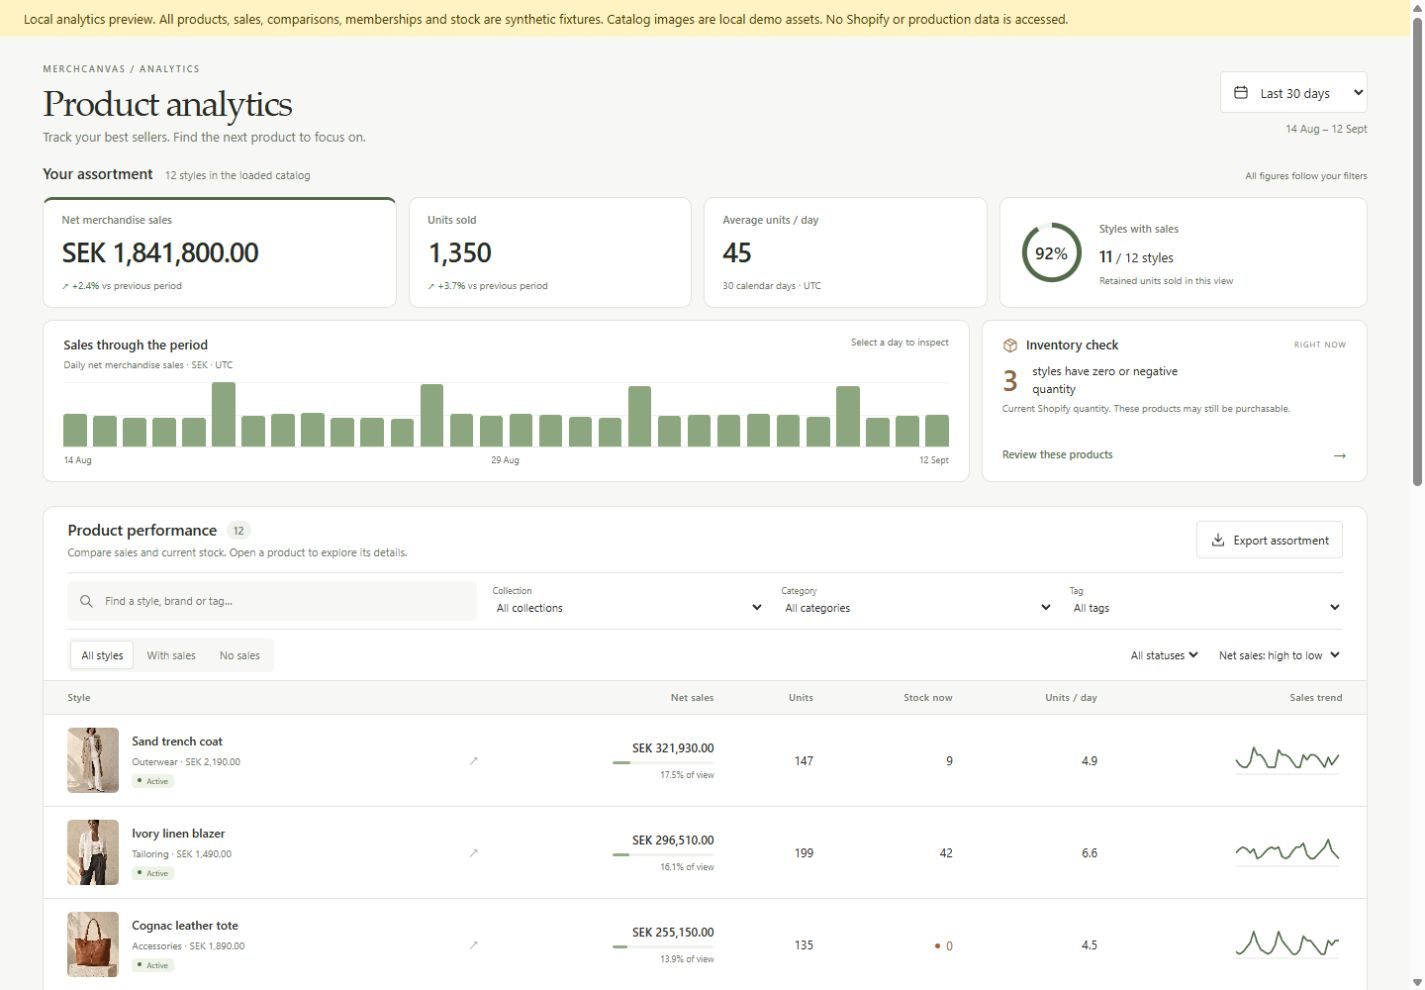
Choose a preset or custom date range, compare it with another period, and group the trend by day, week or month. Export the selected table as CSV or take the complete workbook into Excel.
Approve the required Shopify permissions and sync the store data. Collection engagement also needs measurement enabled and the relevant shopper consent.
Choose a covered date range, refine the filters and inspect the products or collections you want to understand.
Export Excel or CSV with the selected dates and filters. Data definitions travel with the workbook.
You can choose custom dates, but a complete report requires data covering those dates. The current sales service keeps a rolling 60-day snapshot; full-year reporting requires additional historical backfill. Selecting older dates does not create missing history.
No. Sales metrics use retained merchandise value after discounts and refunds, before taxes, and exclude test and cancelled orders. They are not payment settlements or proof of sales caused by MerchCanvas.
No. It reports supported events from enabled collection measurement, subject to shopper consent. Missing measurement is shown as unavailable, not zero. These events are not a count of unique visitors or all store traffic.
Tell us about your store. Let’s see what you can create.
Let’s talk MerchCanvasFor Shopify merchants. Built by Black Pear Studio.